Before understanding the Anthem Biosciences share price target, let us first understand the basic nuances of the company, including its history, business model, background, financial information, and other key factors.
Table of Contents
🏢 Company Snapshot
Parameter
Details
Company Name
Anthem Biosciences Ltd
Industry
CRDMO (Contract Research, Development & Manufacturing Organization)
Biotech + Big Pharma (550+ clients in 44 countries)
Diversified & global
Team
600+ scientists & professionals
Strong R&D foundation
📊 Financial Highlights (₹ in Cr)
Metric
FY23
FY24
FY25
CAGR (2Y)
Revenue
1,133.99
1,483.07
1,930.29
~30%
PAT
385.19
367.31
451.26
~8.4%
EBITDA
446.05
519.96
683.78
~24%
Net Worth
1,740.67
1,924.66
2,409.86
~17%
Total Assets
2,014.46
2,398.11
2,807.58
~18%
Total Borrowing
125.06
232.53
108.95
–
📈 Key Performance Indicators
KPI
Value
ROE
20.82%
ROCE
26.88%
PAT Margin
23.38%
EBITDA Margin
36.81%
Debt-to-Equity
0.05
P/E Ratio
70.62x
Price/Book Value
13.23x
EPS (Pre & Post IPO)
₹8.07
🚀 Growth Drivers (2026–2040)
Growth Lever
Impact
Description
CRDMO Market Expansion
High
Rising global outsourcing of drug R&D
Innovation Pipeline
High
24+ patent filings; biosimilars & enzymes
Global Client Diversification
Medium
Exposure to U.S., EU, Japan
Vertical Integration
Medium
Discovery to commercial scale
Repeat Client Business
High
Strong long-term engagements
⚠️ Key Risks
Risk
Severity
Notes
High Valuation
High
P/E > 70x may limit short-term upside
Offer for Sale Only
Medium
No fresh capital into business
Regulatory Compliance
Medium
Risk in multiple markets, strict R&D norms
IP Risk
Low–Medium
Patent approvals and pending applications
📊 Investment Outlook Summary
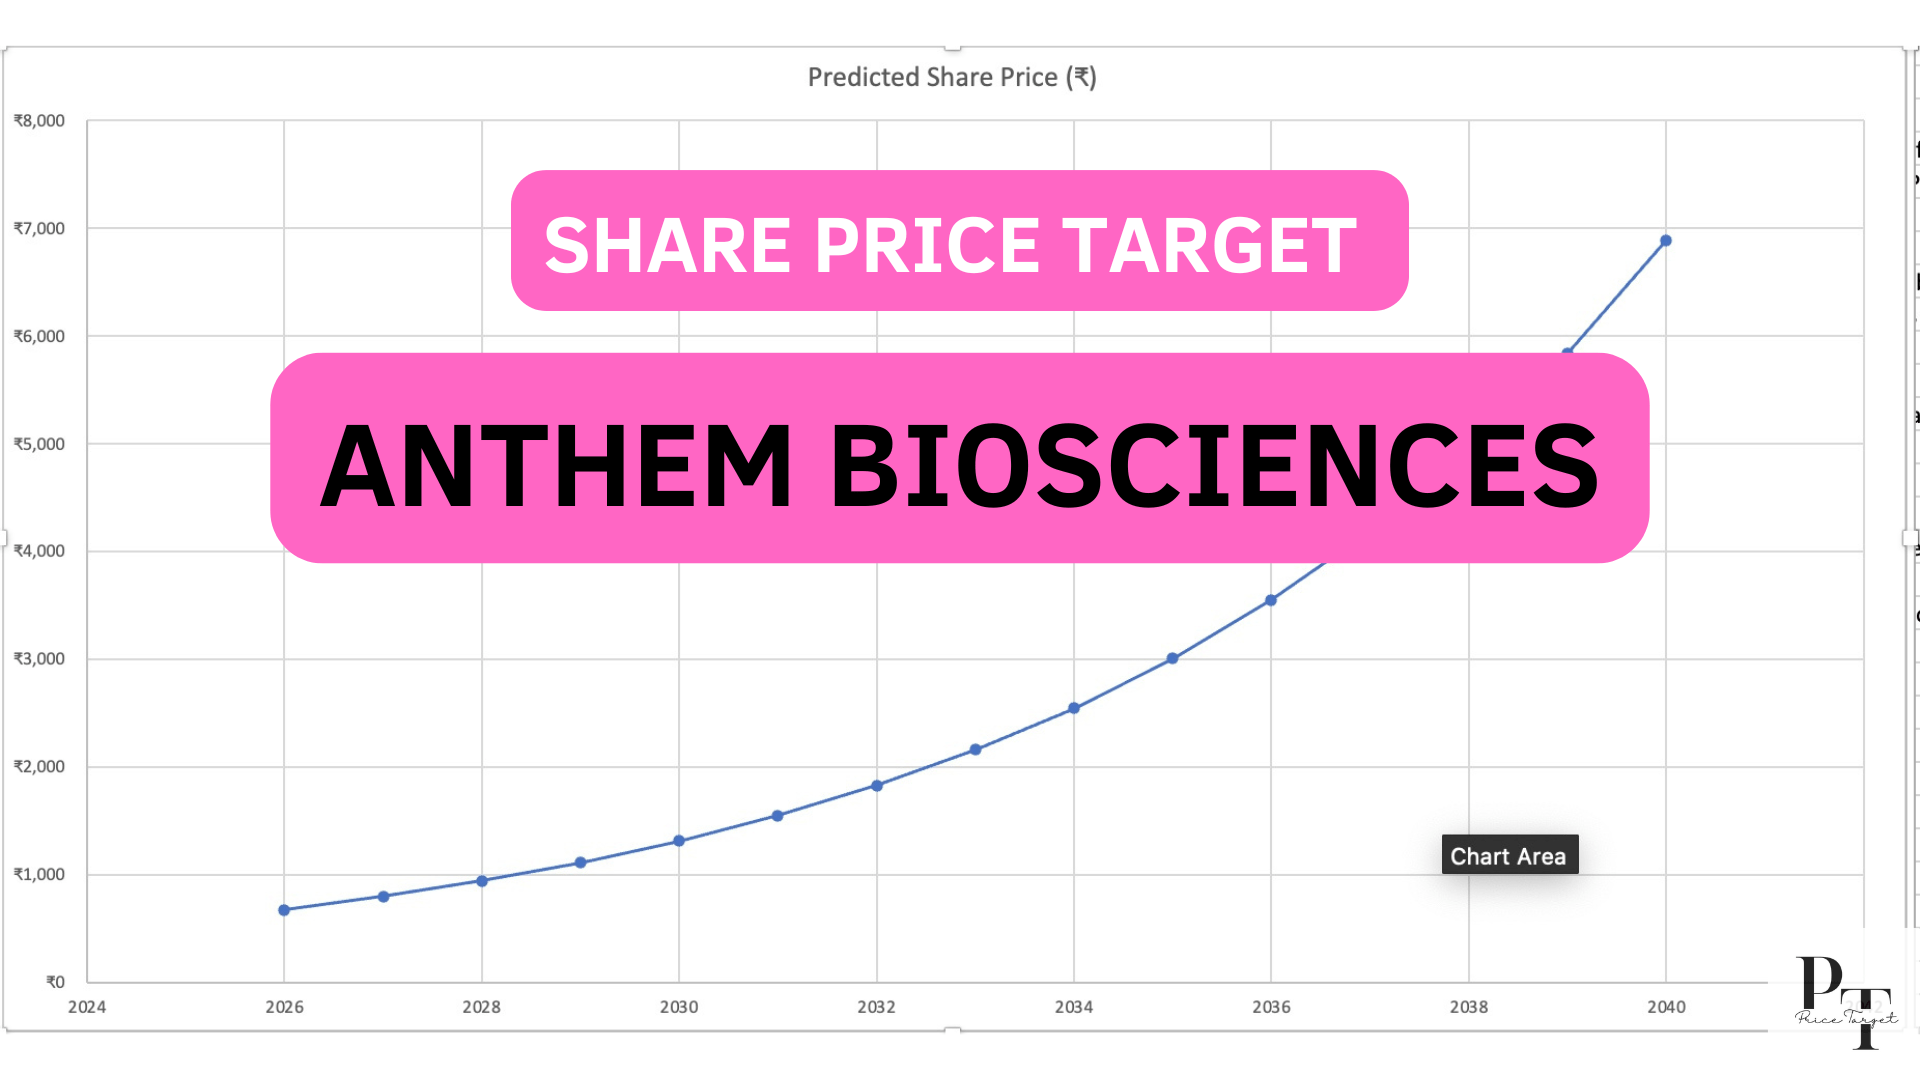
Here’s the Anthem Biosciences Ltd Share Price Target Forecast (2026–2040) assuming a CAGR of 18.215%, starting from a base price of ₹570 (IPO listing price):
Breakthrough GLP-1 and glycolipid licensing revenue surge
Anthem Biosciences Share Price Target 2040
₹6,889
Anthem becomes a global leader in CRDMO and biotech innovation
⚠️ Disclaimer
These projections are based on a steady CAGR of 18.215%, derived from assumptions about Anthem Biosciences’ business growth, sector trends, and global expansion. Actual prices may significantly vary depending on financial performance, industry dynamics, regulatory developments, and macroeconomic conditions. Always consult a SEBI-registered investment advisor before taking any position in equities.

1 thought on “Anthem Biosciences Share Price Target / Forecast (2026–2040)”
Comments are closed.